
Turning meter data into savings: baselines, KPIs and alerts
Why total kWh is a useless measure, how to build an energy baseline against production, and the four analyses that actually find money in metering data.
Most energy monitoring projects end the same way. The meters are installed, the dashboards are built, everyone admires them for two weeks, and then nobody opens them again. The data keeps accumulating and nothing changes.
The problem is almost never the data. It is that the dashboard answers a question nobody has — "how much are we using?" — instead of the question that leads to action: "is that more than it should be?"
Here are the four analyses that turn meter readings into decisions.
1. Stop reporting total kWh
Total consumption is not a performance measure. It goes up when you produce more, which is not a problem, and it goes down during a shutdown, which is not an achievement. A month-on-month comparison of total kWh tells you almost nothing about how well the plant is running.
The measure that works is energy against output:
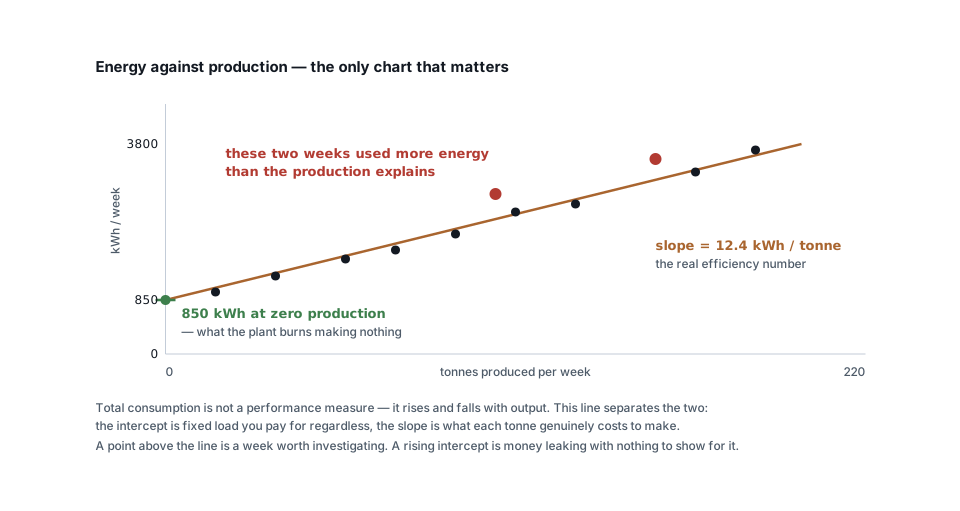
Plot weekly energy against weekly production — tonnes, units, pieces, occupied room-nights, whatever your plant makes — and fit a straight line. Two numbers fall out:
The intercept is what the site consumes at zero production. Fixed load: lighting, HVAC, compressed air leaks, idling equipment, standby power, office. You pay for it whether or not anything is made.
The slope is the specific energy consumption — kWh per unit produced. This is your real efficiency number, and it is the one to track month on month, because it is unaffected by how busy you were.
A plant whose total consumption fell 8 % last month might have produced 15 % less. The slope tells you it actually got worse.
2. Attack the base load first
The intercept is nearly always the cheapest saving available, and it is the one that keeps paying at 3 a.m. on a Sunday.
Look at a full week of interval data and find the minimum. That is your true base load. Then ask what is running:
| Usual suspect | How to confirm |
|---|---|
| Compressed air leaks | Base load falls when the compressor is isolated overnight |
| HVAC running out of hours | Correlate against the BMS schedule |
| Lighting in unoccupied areas | Walk the site at night, once |
| Idling machines on standby | Submeter one, watch a weekend |
| Oversized transformer no-load loss | Constant, unaffected by anything |
Compressed air is the classic. A plant with a compressor running through the night to feed leaks is burning full electrical cost to produce nothing, and the meter data proves it in a way that a walk-round argument never does.
The test costs nothing: shut the plant down properly one weekend and watch the interval data. Whatever is still being consumed at 4 a.m. on Sunday is consumption you are buying for no output at all.
3. Manage maximum demand deliberately
Demand charges are billed on the peak 15 or 30-minute average in the month, so a single bad half-hour sets the charge for all of it. That makes it uniquely worth managing — and uniquely easy to manage badly.
With interval data you can see:
- When the peak occurs, and what was running. Usually two or three large loads that coincided by accident rather than by necessity.
- How close you run to contract demand. Exceeding it attracts a penalty rate, typically one and a half to two times the normal demand charge.
- Whether your contract demand is right at all. Consistently peaking at 70 % of contract means paying for capacity you never use — the reasoning is in connected load, maximum demand and diversity.
The fix is usually scheduling rather than equipment: stagger the start of large loads, avoid running the compressor and the furnace up together, move a batch process off the peak. That costs nothing and it shows up on the very next bill.
4. Track power factor where it is billed
Power factor is measured at the point the utility bills it, so track it there, at the incomer, on the same interval as the demand.
What the data tells you that a single monthly figure cannot:
- Whether the power factor is poor all the time — which suggests fixed compensation — or only at part load, which needs an APFC panel with the right step size.
- Whether an existing capacitor bank is actually switching. A step that has failed shows up as a power factor that stopped responding to load.
- Whether you are going leading at night, which several tariffs penalise as firmly as lagging.
Convert what you see into a target and a capacitor rating with the power factor calculator, and check the money against what the penalty costs.
Alerts that people do not switch off
Fixed thresholds fail in both directions. "Alert if kW > 400" fires every day during normal busy periods and stays silent through a quiet week when something is badly wrong. Within a month everyone ignores the emails.
Alert on deviation from expected instead:
| Alert on | Not on |
|---|---|
| Consumption above the baseline for this production level | A fixed kW threshold |
| Base load higher than last week's minimum | Total daily kWh |
| Demand projected to exceed contract this interval | Demand exceeded (too late) |
| Power factor below target for 3 consecutive intervals | A single low reading |
| Phase currents diverging by more than 15 % | Any single current value |
| No data received for 30 minutes | Nothing — silence is invisible |
That last one matters more than the rest combined. A dead gateway produces a flat line at zero, which looks like a plant that stopped. Alert on the absence of data, not just on its content — the mechanism is in building a gateway.
And set a budget: if an alert fires more than about once a week without producing an action, it is misconfigured. Fix it or delete it. An alert nobody acts on trains everyone to ignore the ones that matter.
Reconcile, or trust nothing
Add up your submeters and compare against the main meter. The difference is unaccounted energy, and it should be small and stable.
- A large gap means an unmetered load, or a CT ratio entered wrongly in the configuration. Both are worth finding.
- A gap that grows means a meter is drifting, or a CT is saturating as load rises.
- A negative gap — submeters totalling more than the main — is almost always a wrong CT ratio or a double-counted feeder.
Do this monthly. It is the only check that tells you whether any of the rest of your analysis is built on real numbers.
Make it somebody's job
The analyses above take an hour a week and they are worth more than the monitoring system cost. But they only happen if:
- One named person reviews the data on a fixed schedule.
- The review produces actions with owners, not observations.
- Savings are verified against the baseline afterwards, so the next investment is easier to justify.
- The baseline is re-fitted when the plant genuinely changes — new equipment, a new product mix — and the old one is kept for comparison.
A monitoring system without that hour is a data logger. The meters, the bus and the gateway are the easy part; they are also the part that gets all the attention, and the part that saves nothing on its own.
Related articles
More on metering & iot.
 Metering & IoT
PROFIBUS and PROFINET: how each is wired, and what breaks
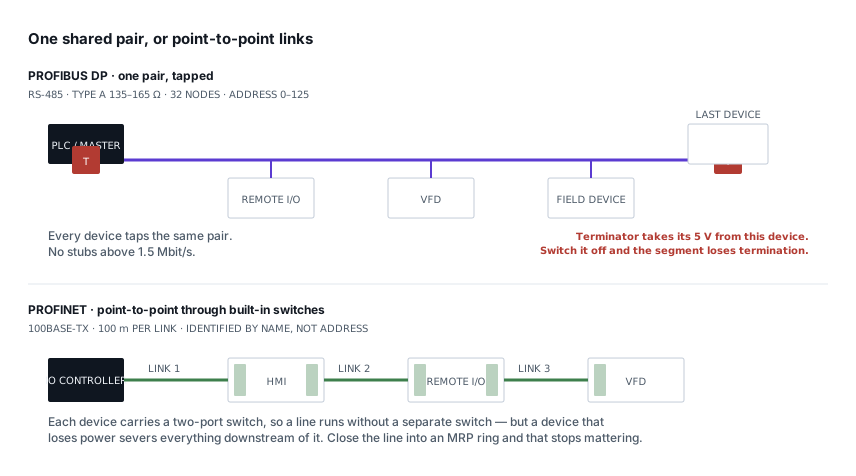
Purple cable at 150 Ω against green Ethernet, powered termination against none, device addresses against device names — and the fault each design invites.
8 min read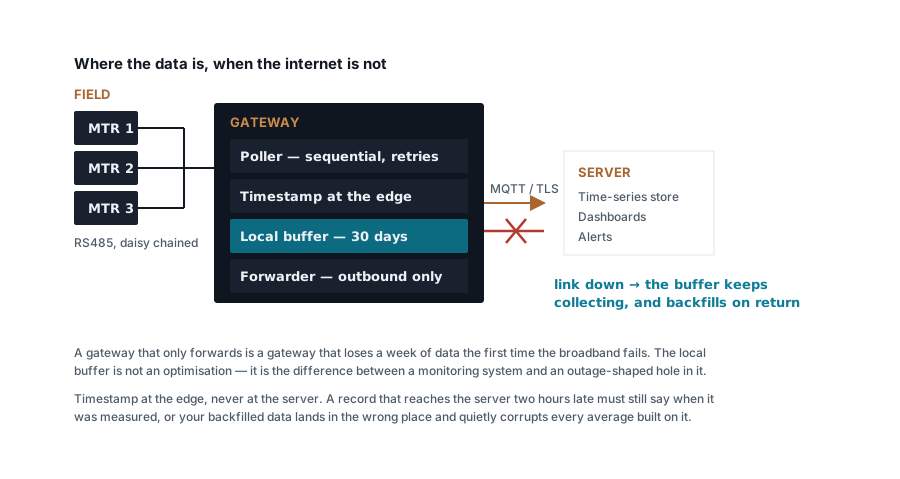 Metering & IoT
Building a Modbus energy monitoring gateway that stays up
Polling design, store-and-forward, timestamping at the edge, SD card wear and the naming convention you cannot change later — a field-grade gateway.
7 min read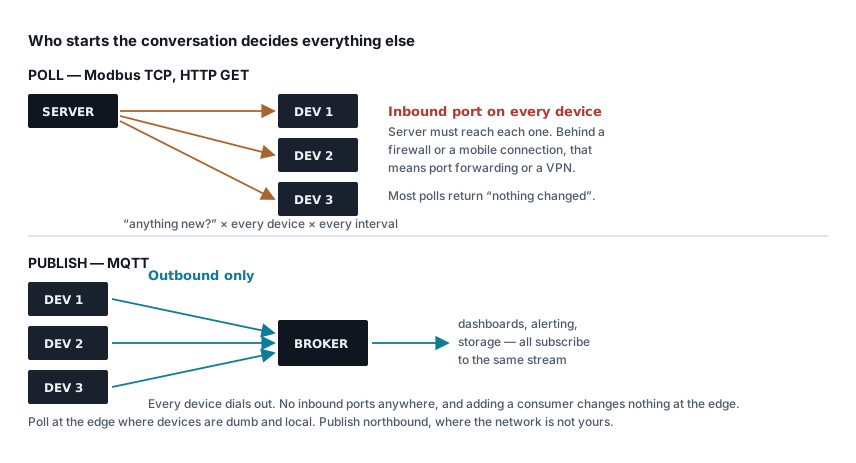 Metering & IoT
MQTT, Modbus TCP or HTTP: moving meter data to a server
Poll versus publish, what each protocol costs in bandwidth and firewall holes, how to design topics and payloads, and where each one genuinely belongs.
7 min read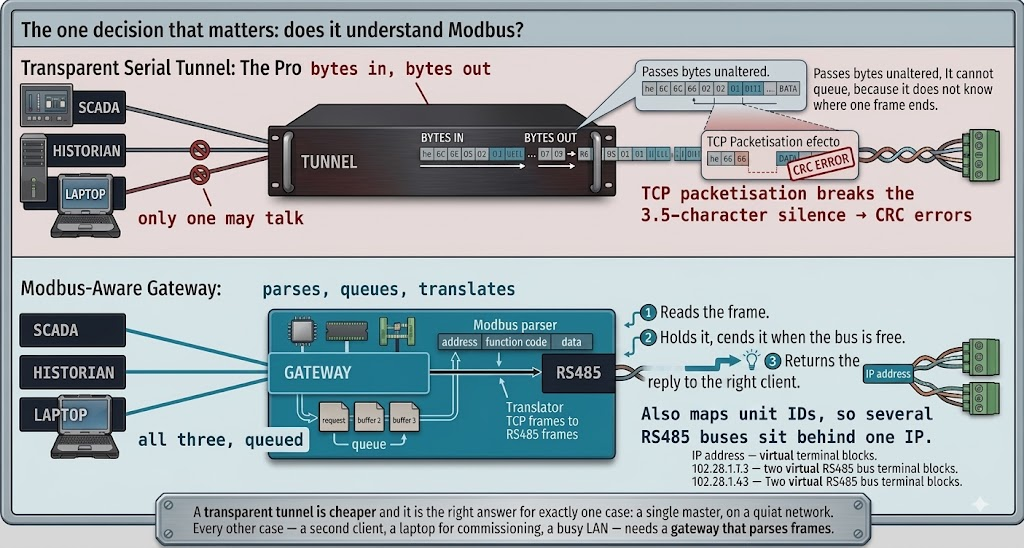 Metering & IoT
Choosing an RS485 to Modbus TCP gateway
Transparent tunnel or protocol gateway, multi-master handling, unit ID mapping and isolation — the specification that decides whether it works in year two.
7 min read
Comments
Loading…